US Energy Consumption Reaches Record High in 2018
U.S. energy consumption set a record high in 2018, with wind, solar, and natural gas making the largest increases in energy supply, according to a new analysis.
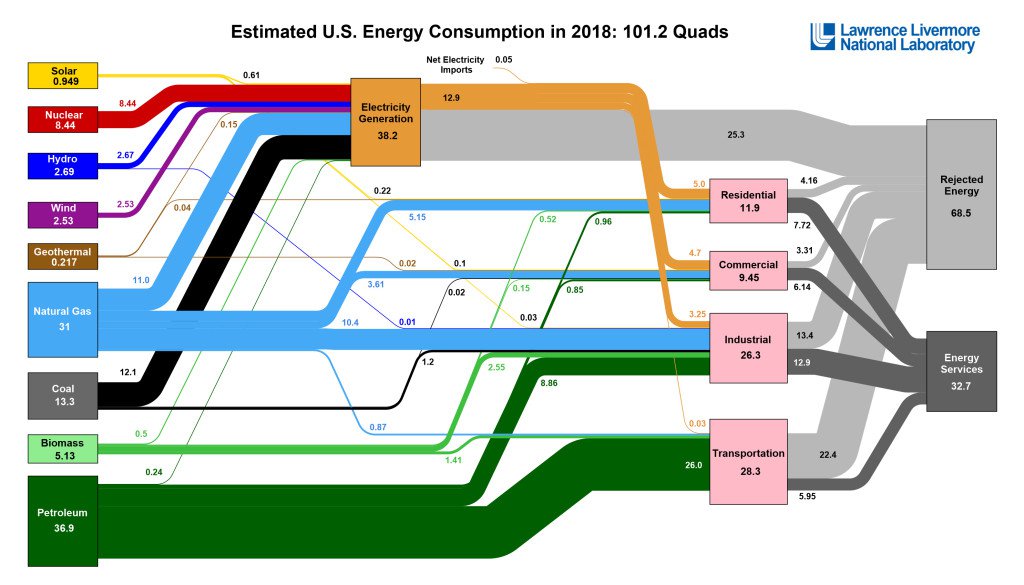
The findings come from Lawrence Livermore National Laboratory, which illustrates the results in its energy flow chart. Overall energy consumption reached 101.2 quadrillion BTU (or “quads”), passing the previous record of 101.0 quads set in 2007. (About 3,400 BTUs equals 1 kWh.) Energy use increased 3.6% from 2017 — the largest annual increase since 2010.

In 2018, solar and wind energy were both up 0.18 quads, representing a 22% gain for solar and a 7.6% jump for wind. In the last decade, LLNL notes that overall renewable energy production has doubled in the U.S. During the same period, solar and wind have risen 48x and 5x, respectively, from where they were in 2008. Combined, they now produce more electricity than hydroelectric power.
Natural gas also jumped 10.7%, increasing by 3 quadrillion BTU from the prior year. The increase in natural gas use reflects an increase in electricity generation.
LLNL energy flow chart 2018
Biomass was up 5%, with most of it used for residential heating. Petroleum (oil) use was up 2%, but “barely budged in the dominant transportation sector,” LLNL’s release notes. As the chart above illustrates, most oil use in the transportation sector ends up as “rejected energy” or heat. Coal consumption fell 5%.
This recent report follows trends seen in a March report from the International Energy Agency which showed global energy demand also grew at its fastest pace in the last decade during 2018, leading to record high CO2 emissions.
